ALLL levels continue their decline
May 11, 2015
ALLL levels generally trend inversely proportional to credit quality and the health of the economy as a whole. Greater funds are needed to cover probable and estimable losses in times of economic despair; conversely, reductions in ALLL levels are often a byproduct of improving economic indicators and credit quality.
Following the recent financial crisis, we have seen a steady improvement of asset quality. With the wake of the crisis still in recent memory, banks are making more thorough credit decisions and, in turn, we’re seeing less net charge-offs and nonperforming loans than in the buildup to ’07-’08. As these indicators rise, the amount necessary to set aside for bad debts falls.
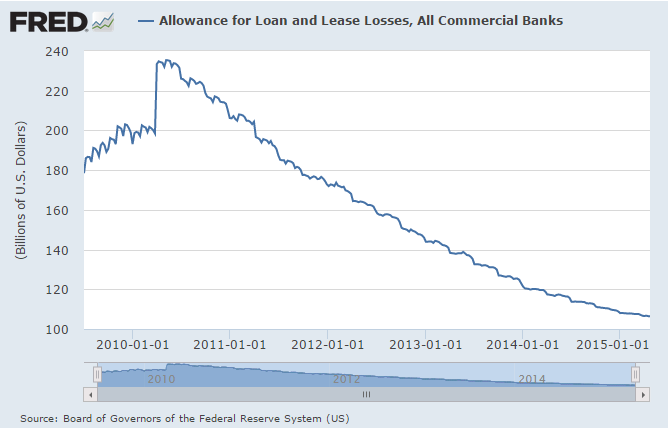
The below chart illustrates the aggregate amount of money tied up in reserves for all commercial banks. We can see a steady decline beginning around the midway point of 2010, as the majority of bad loans made years prior eventually moved to loss. Loans originated after the crisis were subject to tighter credit qualifications, and as a result we’re seeing periods of lower losses in recent years, as the graph reinforces.
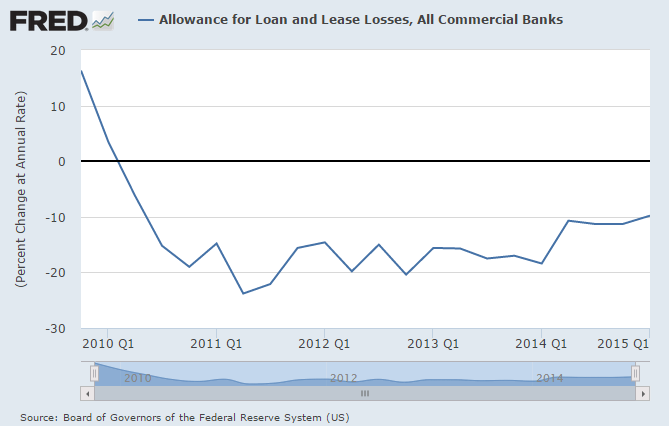
Directly related to this graph is the rate at which allowance levels have been rising or falling. Again, we see a turning point within 2010 where allowance levels begin to decline, and we see that they have remained in a declining state ever since. It can be noted, however, that the rate at which allowance levels are decreasing is slowing, as we see a roughly 10 percent annual decrease in allowance levels in recent quarters compared to 15-20 percent decreases in 2011 and 2012.
According to the latest data released by the Federal Reserve on May 1, ALLL levels for all US commercial banks remained stable at 1.31% of total loans, as cited in this article by Marketrealist.
Banks have confronted and persevered through the effects of the recent subprime crisis. As a result, we’re seeing less nonperforming loans, greater asset quality and a decreasing need for reserves for bad debts. As ALLL levels approach pre-2006 levels, expect the annual rate to move from -10 percent to a more static figure.
One caveat may reverse the trend of declining ALLL levels. The FASB’s current expected credit loss (CECL) model is anticipated to be released in early 2016. The model is expected to increase ALLL levels in the form of a one-time capital adjustment.
For more on the topic, navigate to ALLL.com’s CECL section or prepare with Abrigo’ CECL Prep Kit.